Web Vitals is an initiative by Google to provide unified guidance for quality signals that are essential to delivering a great user experience on the web.
At the center of these quality signals are the three “Core Web Vitals” metrics * Largest Contentful Paint (LCP) * First Input Delay (FID) * Cumulative Layout Shift (CLS)
While all three of them are useful, I’d recommend you begin your analysis with the Largest Contentful Paint. Optimizing for LCP will have the largest absolute improvement in perceived load speed. If loading your website is already slow, being able to interact with the site right away (FID) and reducing layout flickers (CLS) won’t do much to calm your already annoyed users.
Now is the perfect time to get started measuring Web Vitals, because it just got a lot easier since Google recently released their web-vitals JavaScript library that packs the calculations into a neat black box so we don’t have to concern ourselves with the details.
Web Vitals are already tracked for free in Google Search Console
Google Search Console (GSC) is Google’s official webmaster communication tool where you can find lots of data about its performance in Search and other quality indicators – now including the three Core Web Vitals! That means without having to implement anything, you could start optimizing right away since you already know your URLs with particularly bad page speed.
Still, the web-vitals measurements in Google Search Console can’t replace your own data collection:
- Search Console doesn’t show web vitals data for all the pages on your site
- There’s no meta data in GSC that you could use to group pages and aggregate your data. Some aggregations might work based on just the URL such as filtering by template, because maybe your /recipe/… sites share a template that is particularly slow-loading. Aggregations that need additional data, e. g. by traffic (high, medium, low traffic) can be very useful since you’d want to prioritize your page speed optimization on pages where the bulk of your traffic can benefit from it. Right now, this is not possible in GSC.
- Web Vitals in GSC are measurements from real users, not Googlebot, which Google calls “field data”. That’s good, but not all your users are represented in the GSC sample: Only those which are part of the Chrome User Experience Report can show up in Search Console1, i. e. users with a Chrome browser who have opted in to sync their browsing history. Some Web Vitals can me measured in other browsers as well which would only be counted if you measure Web Vitals yourself.
Getting Web Vitals into the dataLayer
The process is: 1. Load the web-vitals JavaScript library 2. Measure the three core metrics 3. Push the result to dataLayer
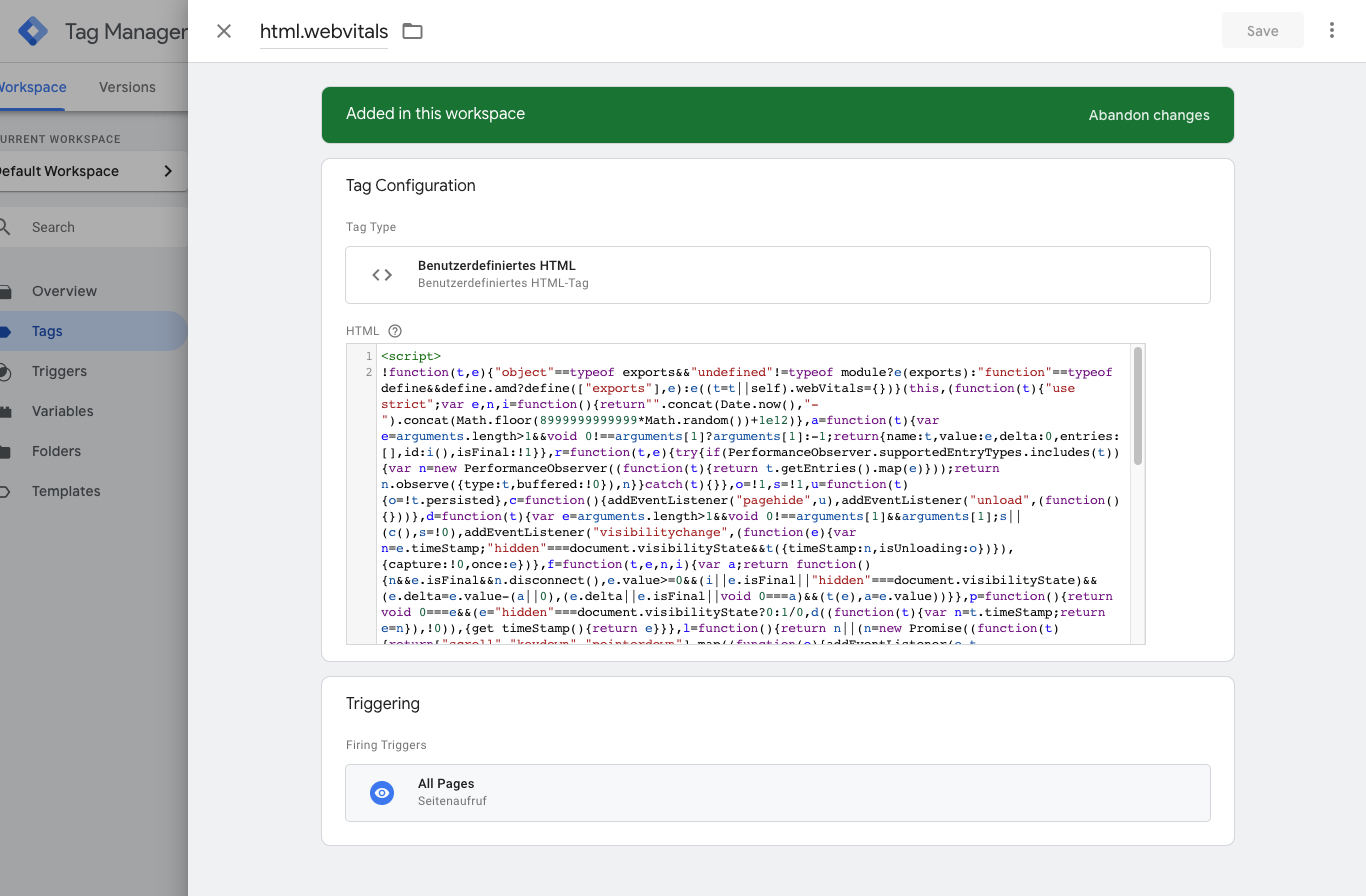
You can load the webvitals library from a CDN as laid out in Web Vitals: Loading Web Vitals from a CDN. That’s okay, but for production, I recommend you copy the small script from https://unpkg.com/[email protected]/dist/web-vitals.es5.umd.min.js directly into GTM as a tag, that way you are not dependent on the unpkg.com servers.
<script>
!function(t,e){"object"==typeof exports&&"undefined"!=typeof module?e(exports):"function"==typeof define&&define.amd?define(["exports"],e):e((t=t||self).webVitals={})}(this,(function(t){"use strict";var e,n,i=function(){return"".concat(Date.now(),"-").concat(Math.floor(8999999999999*Math.random())+1e12)},a=function(t){var e=arguments.length>1&&void 0!==arguments[1]?arguments[1]:-1;return{name:t,value:e,delta:0,entries:[],id:i(),isFinal:!1}},r=function(t,e){try{if(PerformanceObserver.supportedEntryTypes.includes(t)){var n=new PerformanceObserver((function(t){return t.getEntries().map(e)}));return n.observe({type:t,buffered:!0}),n}}catch(t){}},o=!1,s=!1,u=function(t){o=!t.persisted},c=function(){addEventListener("pagehide",u),addEventListener("unload",(function(){}))},d=function(t){var e=arguments.length>1&&void 0!==arguments[1]&&arguments[1];s||(c(),s=!0),addEventListener("visibilitychange",(function(e){var n=e.timeStamp;"hidden"===document.visibilityState&&t({timeStamp:n,isUnloading:o})}),{capture:!0,once:e})},f=function(t,e,n,i){var a;return function(){n&&e.isFinal&&n.disconnect(),e.value>=0&&(i||e.isFinal||"hidden"===document.visibilityState)&&(e.delta=e.value-(a||0),(e.delta||e.isFinal||void 0===a)&&(t(e),a=e.value))}},p=function(){return void 0===e&&(e="hidden"===document.visibilityState?0:1/0,d((function(t){var n=t.timeStamp;return e=n}),!0)),{get timeStamp(){return e}}},l=function(){return n||(n=new Promise((function(t){return["scroll","keydown","pointerdown"].map((function(e){addEventListener(e,t,{once:!0,passive:!0,capture:!0})}))}))),n};t.getCLS=function(t){var e=arguments.length>1&&void 0!==arguments[1]&&arguments[1],n=a("CLS",0),i=function(t){t.hadRecentInput||(n.value+=t.value,n.entries.push(t),s())},o=r("layout-shift",i),s=f(t,n,o,e);d((function(t){var e=t.isUnloading;o&&o.takeRecords().map(i),e&&(n.isFinal=!0),s()}))},t.getFCP=function(t){var e=a("FCP"),n=p(),i=r("paint",(function(t){"first-contentful-paint"===t.name&&t.startTime<n.timeStamp&&(e.value=t.startTime,e.isFinal=!0,e.entries.push(t),o())})),o=f(t,e,i)},t.getFID=function(t){var e=a("FID"),n=p(),i=function(t){t.startTime<n.timeStamp&&(e.value=t.processingStart-t.startTime,e.entries.push(t),e.isFinal=!0,s())},o=r("first-input",i),s=f(t,e,o);d((function(){o&&(o.takeRecords().map(i),o.disconnect())}),!0),o||window.perfMetrics&&window.perfMetrics.onFirstInputDelay&&window.perfMetrics.onFirstInputDelay((function(t,i){i.timeStamp<n.timeStamp&&(e.value=t,e.isFinal=!0,e.entries=[{entryType:"first-input",name:i.type,target:i.target,cancelable:i.cancelable,startTime:i.timeStamp,processingStart:i.timeStamp+t}],s())}))},t.getLCP=function(t){var e=arguments.length>1&&void 0!==arguments[1]&&arguments[1],n=a("LCP"),i=p(),o=function(t){var e=t.startTime;e<i.timeStamp?(n.value=e,n.entries.push(t)):n.isFinal=!0,u()},s=r("largest-contentful-paint",o),u=f(t,n,s,e),c=function(){n.isFinal||(s&&s.takeRecords().map(o),n.isFinal=!0,u())};l().then(c),d(c,!0)},t.getTTFB=function(t){var e,n=a("TTFB");e=function(){try{var e=performance.getEntriesByType("navigation")[0]||function(){var t=performance.timing,e={entryType:"navigation",startTime:0};for(var n in t)"navigationStart"!==n&&"toJSON"!==n&&(e[n]=Math.max(t[n]-t.navigationStart,0));return e}();n.value=n.delta=e.responseStart,n.entries=[e],n.isFinal=!0,t(n)}catch(t){}},"complete"===document.readyState?setTimeout(e,0):addEventListener("pageshow",e)},Object.defineProperty(t,"__esModule",{value:!0})}));
<script>
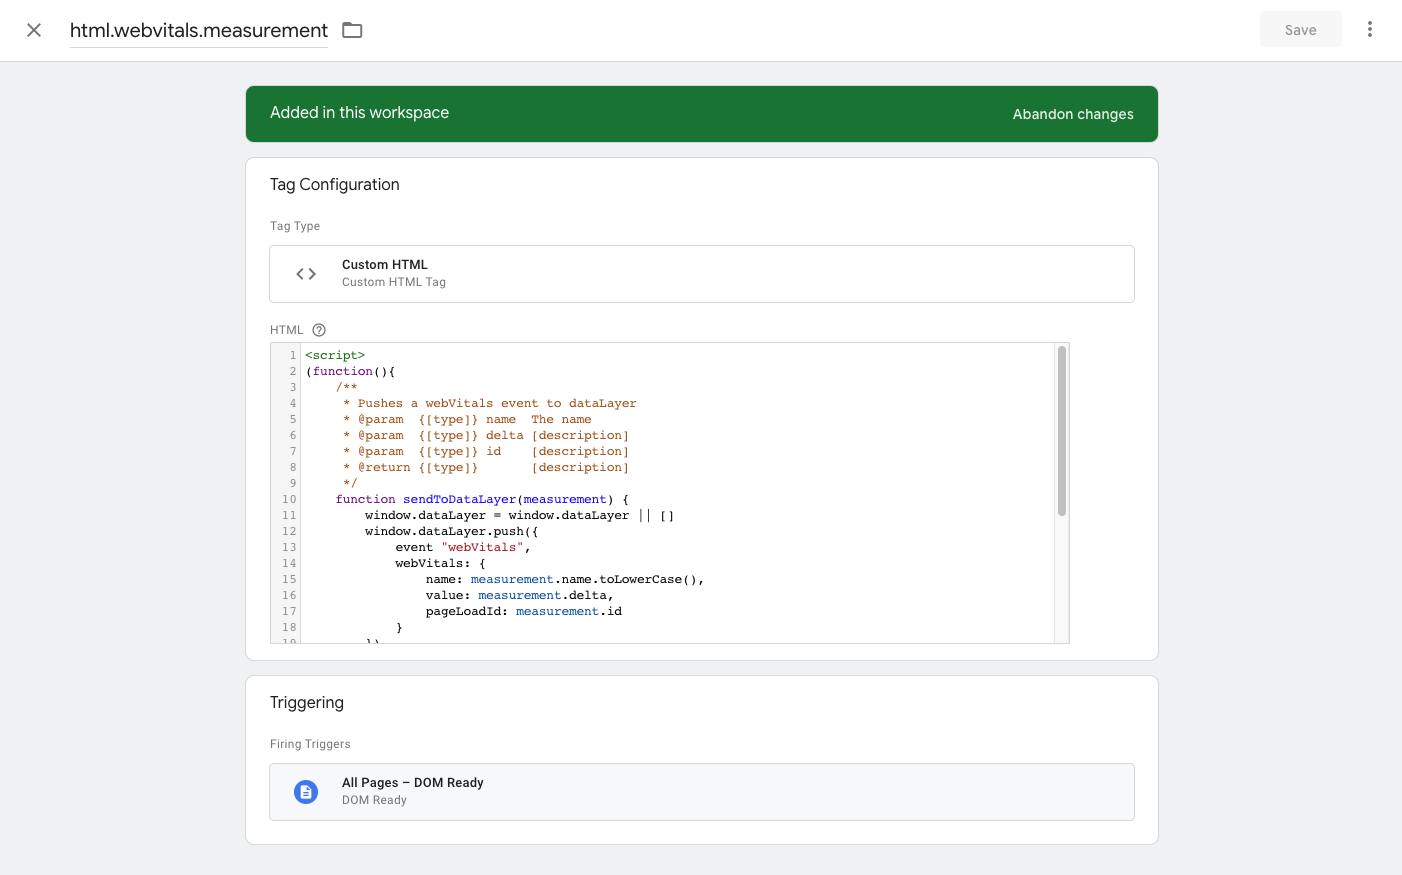
Then we can add the script that’s responsible for actually starting the performance measurement. It will be triggered a little later, when the DOM is ready, so we’ll use a different trigger.
<script>
(function(){
    /**
     * Pushes a webVitals event to dataLayer
     * @param  {[type]} name  The name
     * @param  {[type]} delta [description]
     * @param  {[type]} id    [description]
     * @return {[type]}       [description]
     */
    function sendToDataLayer(measurement) {
        window.dataLayer = window.dataLayer || []
        window.dataLayer.push({
            event "webVitals",
            webVitals: {
                name: measurement.name.toLowerCase(),
                value: measurement.delta,
                pageLoadId: measurement.id
            }
        })
    }

    // window.webVitals is only available because we loaded
    // the library with the previous tag
    window.webVitals.getCLS(sendToDataLayer)
    window.webVitals.getFCP(sendToDataLayer)
    window.webVitals.getFID(sendToDataLayer)
    window.webVitals.getLCP(sendToDataLayer)
    window.webVitals.getTTFB(sendToDataLayer)
})()
</script>
The sendToDataLayer function is used as a callback so it gets executed whenever one of the window.webVitals.get… functions have finished.
The five functions listed there are all that the web-vitals library supports, feel free to remove some if you don’t need them all.
You’ll notice that I changed the event attributes from the documentation a bit and replaced the generic “eventCategory”, “eventAction” and “eventLabel” with specific keys. Check my Google Tag Manager Guidelines to see why that’s a good idea.
I also convert the metric name with .toLowerCase() just because I prefer the look of “lcp” over “LCP” in my events.
Configure Google Tag Manager to send a Google Analytics event
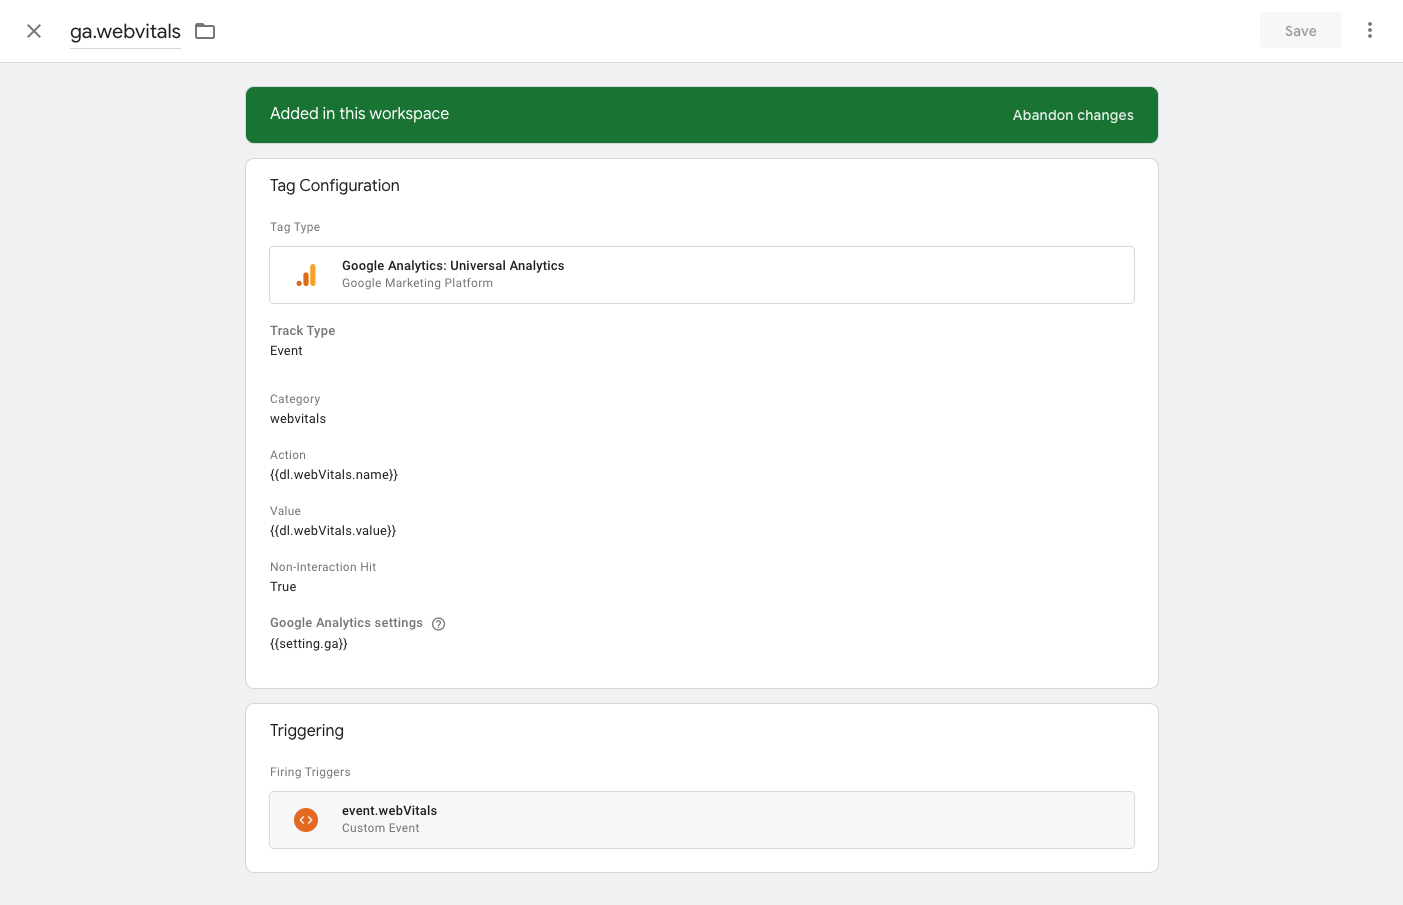
Whenever one of the measurements from our Custom HTML tag finishes, the resulting webVitals will trigger this Google Analytics tag. That tag will send an event to Google Analytics with
* the aptly named event category “webvitals”
* the name of the metric as the event action and
* the result of the measurement for that metric as the event value
The event should be configured as a non-interaction event to keep it from artificially lowering our bounce rate.
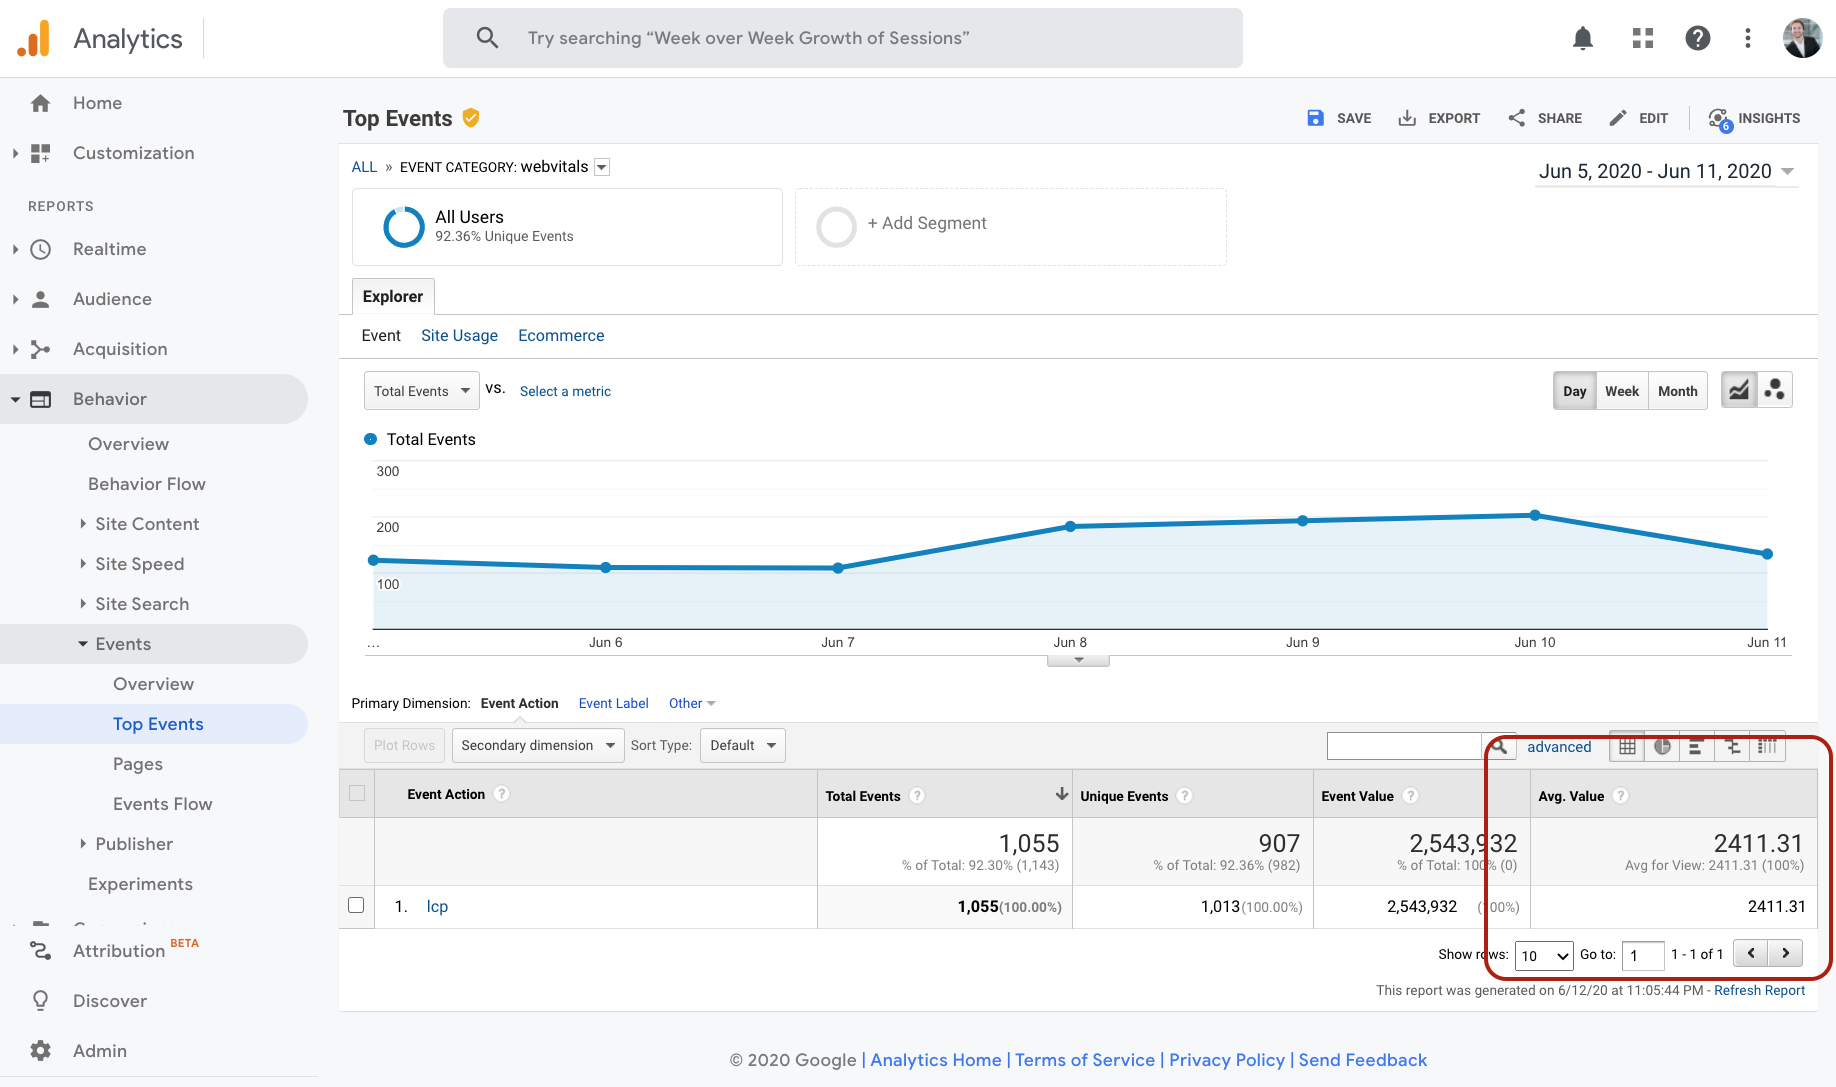
Analysis in Google Analytics
With the above implementation, you’ll already be able to see the measurements when looking at the average event value.